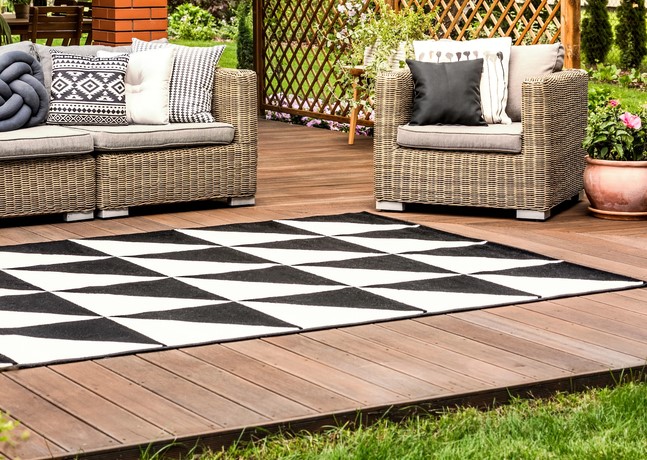
Two summers ago, I was hosting a barbecue on a newly completed composite deck in Austin, Texas. The homeowner had invested over $25,000 in custom teak outdoor furniture, pristine composite boards, and a gorgeous woven polypropylene patio rug to anchor the space. Less than twenty minutes into the party, a gust of wind caught the corner of the unanchored rug, folding it over just as a guest stepped backward with a glass of red wine.
The resulting slip almost sent him over the railing, spilt wine across the raw teak, and ruined the afternoon.
When I looked beneath the rug, the homeowner had used standard indoor double-sided tape—which had melted into a sticky, useless goop under the intense southern heat. We cleaned the deck surface, applied a heavy-duty outdoor rug tape engineered specifically for exterior environmental exposure, and secured the perimeter. Two years later, that same rug hasn’t shifted an inch through torrential rainstorms or 100°F heatwaves. Over my 10+ years in exterior remodeling and hardscape restoration, I have learned that outdoor living spaces are only as functional as their stability.
The Physics of Exterior Instability: Why Standard Adhesives Fail Outdoors
To understand why an outdoor rug tape is vital for deck and patio safety, you have to appreciate the brutal mechanical and environmental forces acting on exterior surfaces.
Unlike climate-controlled living rooms, outdoor decks, concrete patios, and pavers are subject to continuous thermal expansion, moisture accumulation, UV radiation breakdown, and shear forces from foot traffic. Standard carpet tapes rely on water-soluble acrylics or basic rubber adhesives. When exposed to rain or morning dew, these adhesives hydrolyze—meaning the water molecules break down the chemical bonds, turning the tape into a slick lubricant rather than a fastener.
Think of an unanchored outdoor rug on a smooth composite deck like a sled on an ice rink. Without a high-shear adhesive bond acting as a traction anchor, any lateral force from a running child or a sudden gust of wind will cause the rug to slide effortlessly across the surface.
+-----------------------------------------------------------------------+
|                    Exterior Adhesive Degradation                      |
|                                                                       |
|  [ Standard Indoor Tape ] ---> Water & UV Exposure ---> Hydrolysis    |
|                                                         & Total Slip  |
|                                                                       |
|  [ Outdoor Rug Tape ]   ---> Waterproof Synthetic   ---> High Shear   |
|                              Rubber / Silicone Bond      Stability    |
+-----------------------------------------------------------------------+
Material Chemistry: Acrylic vs. Synthetic Rubber and Mesh Carrier Substrates
Selecting the correct outdoor rug tape requires looking beyond the packaging graphics and evaluating the chemical composition of the adhesive matrix and central reinforcement core.
1. Waterproof Synthetic Rubber (Hot-Melt) Adhesives
Synthetic rubber formulations offer extreme initial tack and high shear strength across uneven surfaces like stamped concrete, brick pavers, and rough-sawn timber. They excel at gripping coarse rug backings, though prolonged exposure to temperature extremes above 150°F can cause subtle adhesive softening.
2. Solvent-Based Pure Acrylic Adhesives
High-performance acrylic tapes are engineered for extreme weather durability. They resist UV oxidation, chemical leaching, and direct water submersion. While they require up to 24 hours to achieve maximum cross-linked bond strength, they perform flawlessly across smooth composite decking, porcelain pavers, and sealed natural stone.
| Adhesive Properties | Synthetic Rubber Tape | Solvent Acrylic Tape | Silicone-Coated Mesh |
| Initial Surface Tack | High (Instant Hold) | Moderate (Cures over time) | High |
| Moisture / Water Resistance | Good | Exceptional (Submersible) | Exceptional |
| Temperature Tolerance Range | -10°F to 140°F | -20°F to 200°F+ | -30°F to 180°F |
| Removability / Residue | Moderate | Leaves minimal residue | 100% Residue-free |
| Best Substrate Pairings | Brick, Rough Concrete, Unsealed Wood | Composite Decking, Porcelain, Tile | Sealed Wood, Natural Stone |
Step-by-Step Field Execution: Securing Your Outdoor Rug for All-Weather Endurance
Applying outdoor rug tape isn’t complicated, but skipping proper surface preparation will cause even military-grade adhesives to fail within weeks.
-
Decontaminate the Hardscape Substrate: Sweep away loose dirt, leaves, and grit. Scrub the deck or patio area using a mild detergent or diluted isopropyl alcohol solution to remove natural oils, tree sap, and algae spores.
-
Ensure Absolute Surface Dryness: Allow the floor surface to dry completely for at least 12 to 24 hours. Applying any pressure-sensitive tape over trapped moisture inhibits initial chemical wetting and ruins the adhesive bond line.
-
Apply Tape to the Hardscape Frame: Unroll the outdoor rug tape along the perimeter where the edges of the rug will rest, plus a crisscross “X” pattern across the center for large rugs (8×10 feet or larger). Press the tape down firmly with a hand roller or seam squeegee before peeling back the release liner.
-
Position and Roll the Rug: Align your rug carefully, unrolling it slowly over the exposed adhesive grid. Once positioned, walk along the taped border, applying heavy downward body weight to activate the pressure-sensitive adhesive bonds.
Pro Tips for Exterior Surface Protection and Residue Management
Over a decade of restoring damaged wood decks and stained stone patios, I have developed strict rules to ensure tape removal never damages underlying exterior assets:
Pro Tip: Perform a 24-Hour Spot Test on high-value substrates. Before taping down a large rug on custom composite decking or soft natural travertine, apply a 3-inch strip of outdoor rug tape in an inconspicuous corner. Leave it exposed to direct sunlight for 24 hours, then peel it back to verify that no oil discoloration or sticky residue remains.
To remove old tape clean without stripping deck stain or sealant, warm the tape using a standard hair dryer or heat gun on low heat for 30 seconds. The heat softens the adhesive matrix, allowing you to peel the backing away cleanly without scraping the substrate.
Hidden Warnings: 3 Critical Mistakes That Ruin Exterior Taping Projects
Avoid these three frequent field mistakes that lead to rotting decking, ruined rugs, or dangerous slipping hazards:
-
Warning 1: Trapping Standing Water Under Impermeable Tapes. Running solid, non-porous tape strips around the entire continuous border of an outdoor rug creates an artificial water dam. Rainwater collects under the rug, leading to wood rot, mildew growth, and cupped deck boards. Always leave 2-inch drainage gaps every 18 inches along tape lines to allow water to flow away freely.
-
Warning 2: Using Tape on Freshly Stained or Sealed Decking. Applying heavy-duty adhesives to newly stained or sealed wood deck surfaces before the finish has fully cured (typically 30 days) will pull the finish right off the wood grain upon removal.
-
Warning 3: Ignoring Material Compatibility with Vinyl/PVC Decking. Certain rubber-based adhesives contain plasticizers that react chemically with PVC decking boards, causing permanent yellow stains. Always choose an acrylic-based outdoor rug tape explicitly rated as vinyl-safe.
  [ Incorrect Continuous Border ]
               ||
               \/
+-------------------------------+  <-- Trapped Water Dam!
| Continuous Tape Line (No Gap) |  <-- Water cannot drain out
+-------------------------------+
| Deck Board / Wood Grain       |  <-- Causes wood rot, algae, & cupping
Securing your outdoor living spaces doesn’t require permanent screws, heavy anchors, or sacrificing aesthetic appeal. By choosing the right chemical adhesive, preparing your substrate thoroughly, and leaving drainage gaps for rainwater runoff, applying a quality outdoor rug tape protects your exterior assets and keeps your outdoor gatherings safe and stable year-round.
Are you currently setting up an outdoor patio space or struggling to keep a deck rug from sliding around in high winds? What decking or patio materials are you working with on your property? Drop your questions or project ideas in the comments below!